Active Top Secret Clearance · Open to Opportunities

Olalekan
I. Sodipo
U.S. Army Veteran · Linux Engineer · DevSecOps Engineer
AWS SysOps Admin · Security+ · Linux+ · RHCSA
U.S. Army Veteran · Linux Engineer · DevSecOps Engineer
AWS SysOps Admin · Security+ · Linux+ · RHCSA
Experienced Linux and DevSecOps Engineer with 8+ years managing and securing enterprise systems across on-premises and AWS environments.
Skilled in Red Hat, VMware ESXi, GitLab, and Splunk, with deep expertise in automation using Ansible and Red Hat Satellite. Daily AWS SysOps operations across EC2, S3, CloudWatch, CloudTrail, IAM, VPC, ELB, Auto Scaling, RDS, and Systems Manager.
Proficient in containerization with Docker and Kubernetes, performance tuning, and incident response. Integrated DevSecOps tools like Prisma Cloud and JFrog Artifactory. Holds an Active Top Secret Clearance supporting secure federal and defense projects.
Full-stack infrastructure monitoring with proactive alerts to detect and resolve issues before impact. Containerized deployment with custom dashboards and escalation policies.
View Dashboard →Designed and implemented pipeline automation for Linux deployments. Reduced manual intervention and streamlined code deployment across environments using GitLab and Jenkins.
View GitLab →Supported patching and vulnerability scanning across 10,000+ endpoint enterprise environment, using Red Hat Satellite and Nessus. Automated STIG compliance reporting for DoD audits.
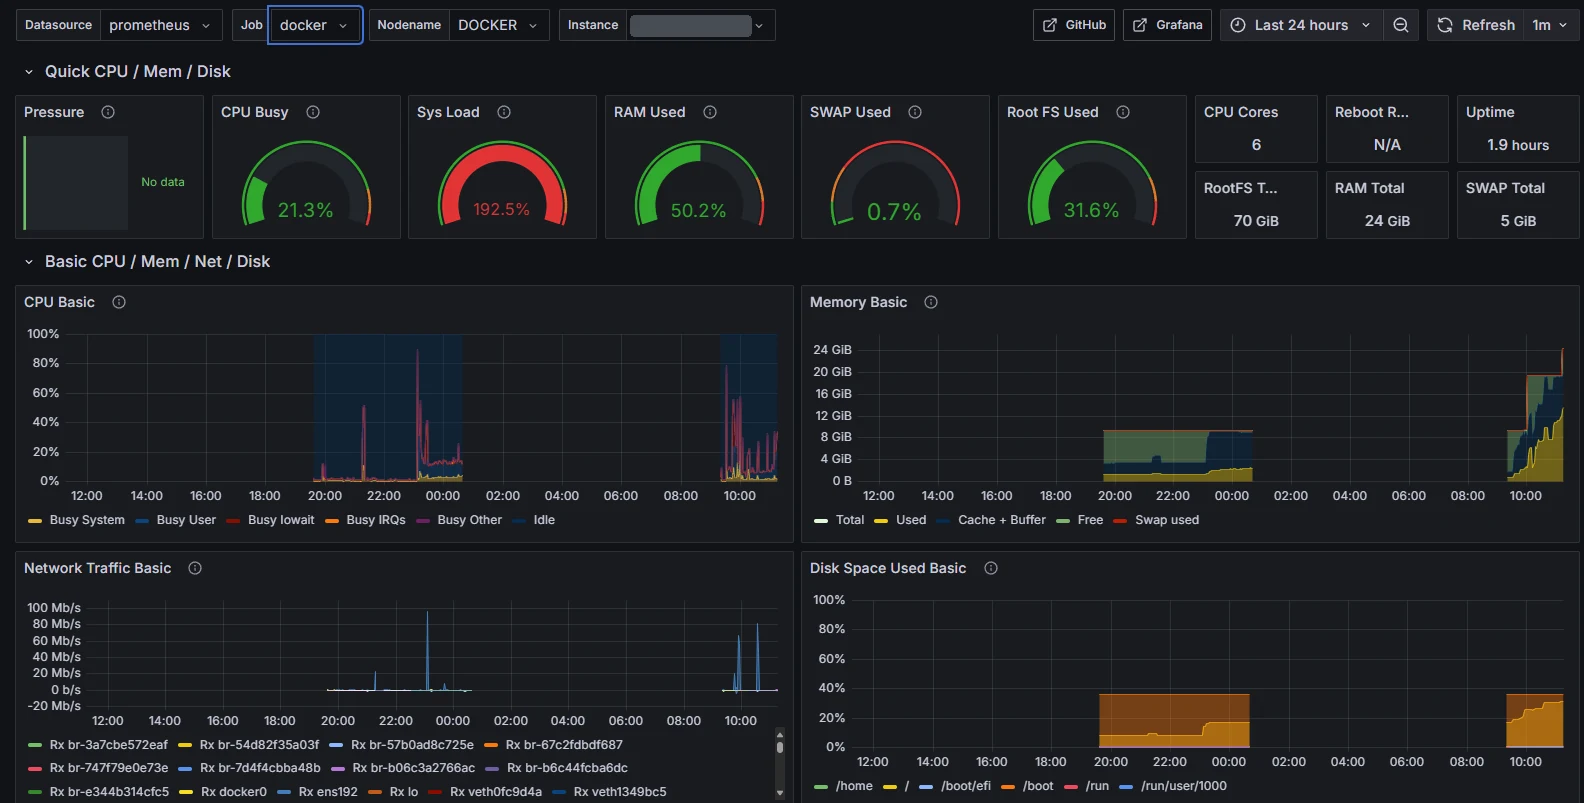
View Nessus →Grafana dashboards powered by Prometheus metrics to visualize Linux server performance, resource utilization, and infrastructure health in real-time.
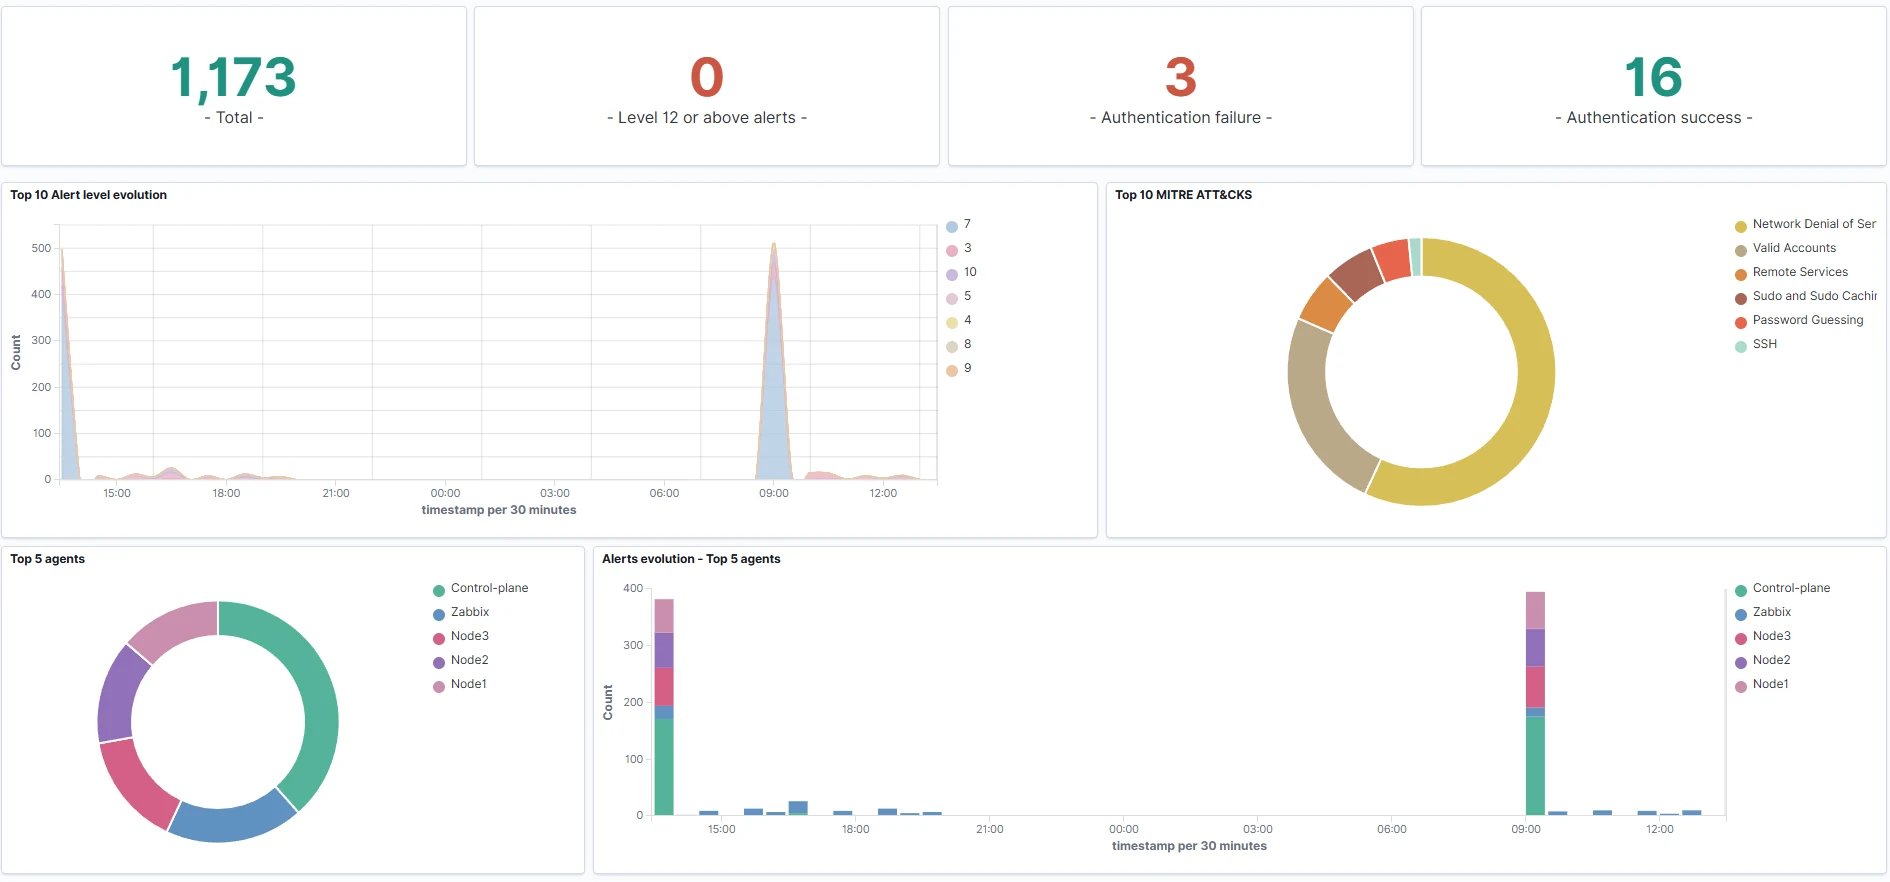
View Grafana →Centralized syslog and security event data using Wazuh agents and Filebeat to forward events to Splunk. Enabled log correlation, alerting, and proactive incident response across Linux, Windows, and Docker containers.
View Splunk →Configured and managed Git repositories in Bitbucket for collaborative development, including CI/CD pipeline integration for automated deployments.
View Repos →Lifecycle and patch management for enterprise Linux systems including automated STIG compliance and content view management across environments.
Manage Hosts →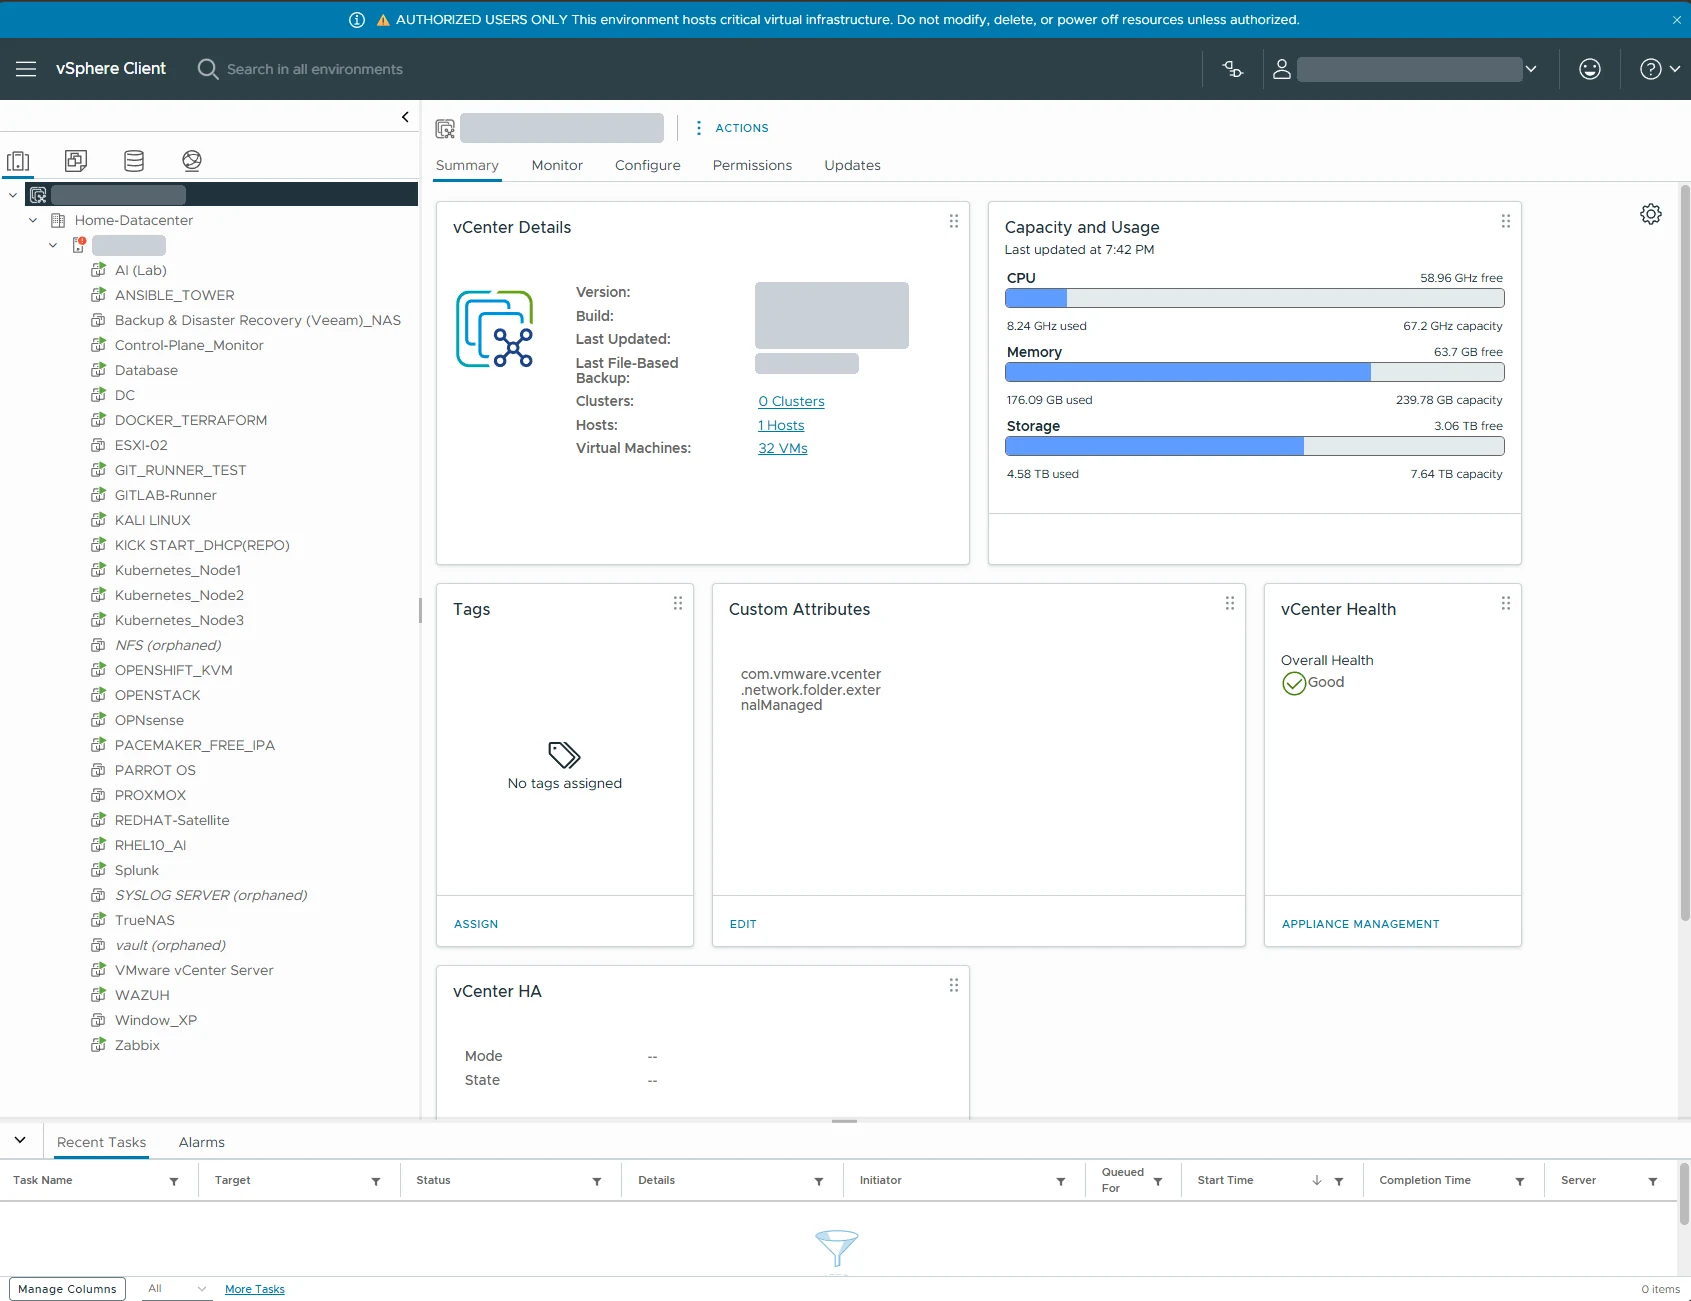
Build and deployment pipelines for Linux infrastructure. Runs automated jobs alongside GitLab CI to test, package, and roll out changes across homelab environments.
Launch Jenkins →Web-based interface to monitor and manage system performance and services across Kubernetes nodes. Supports real-time resource tracking for k3s workloads running on RHEL servers.
Live Console →TrueNAS with ZFS for high-performance, fault-tolerant storage. SMB/NFS shares, iSCSI targets, periodic snapshots, and remote replication integrated with AD for centralized access control.
Access Storage →Centralized orchestration of playbooks, inventory management, and job scheduling. Automates Linux patching, application deployment, and infrastructure provisioning across multiple environments.
Launch Tower →Host-based intrusion detection across the homelab. Wazuh agents handle file integrity monitoring, vulnerability detection, and security alerting, with events forwarded to Splunk for correlation.
Launch Wazuh →Enterprise lifecycle and patch management for RHEL systems. Manages content views, activation keys, errata, and automated STIG compliance reporting across all Linux hosts in the homelab.
Manage Hosts →Every console above runs on hardware in my own rack. Some require credentials or a VPN session — happy to walk through any of them live in an interview.
Available for DevSecOps, Linux Engineering, and Cloud roles. Holds an Active Top Secret Clearance and is open to federal, DoD, and enterprise opportunities.